Understand your payment landscape
Gain a complete understanding of your payment ecosystem through insightful analytics. Access all critical payment data from a centralized platform, including:- Payment volumes
- Transaction types
- Payment methods
- Customer demographics
Overview
A high-level overview of your payment processing, including total payment volume, average ticket size, and conversion rate trends.
Volume
Details on payment volume, refunds and chargebacks by provider, payment method, and country.
Conversion rate
Performance metrics including approval rates, retry attempts, and validation success.
Fraud
Fraud detection and prevention metrics, including fraud rates and pattern insights.
Informed decision-making
The data presented within Yuno Insights is strategically organized around two core facets:- Volume: Data aligned with business metrics to understand the overall flow and value of your transactions.
- Performance: Operational efficiency data to gauge the effectiveness and success rate of your payment processes.
- Overall and segmented conversion rates (by payment method and provider) to identify top-performing options.
- Detailed information on declined transactions, helping you understand and address reasons for non-conversion.
- Clear visibility into transaction volume trends, allowing you to track growth and identify fluctuations.
Tailor and export insights
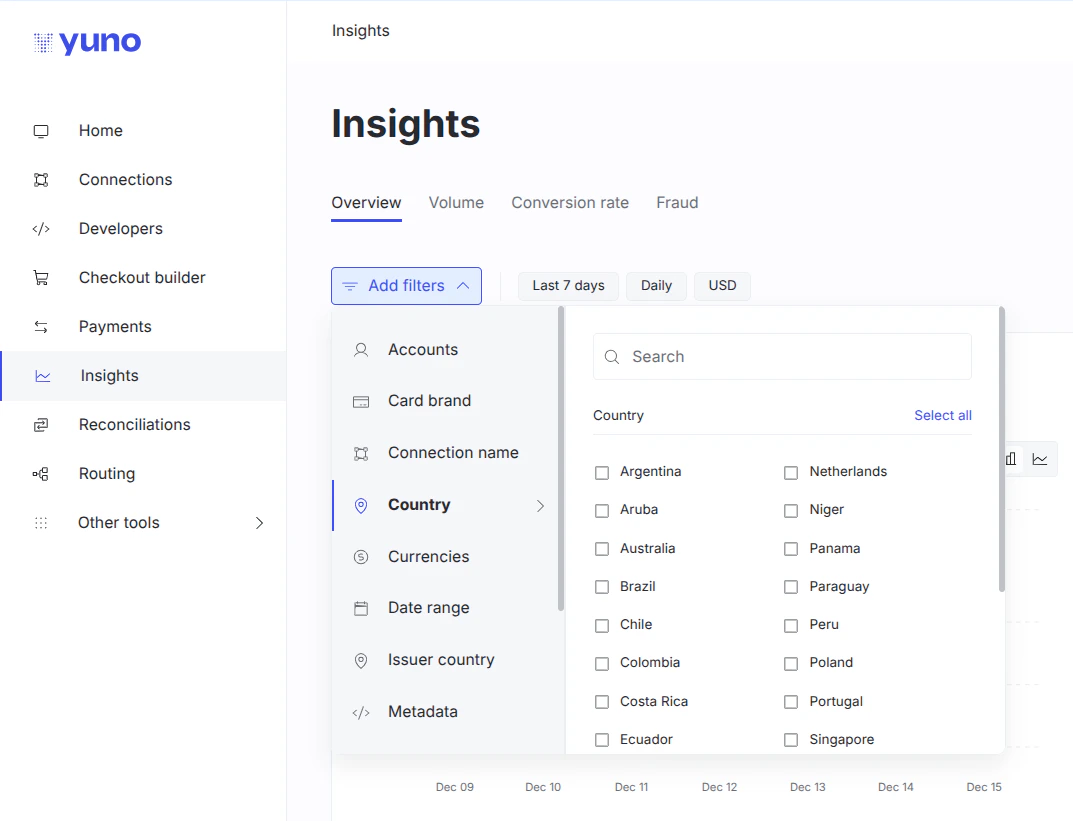
The Insight section contains several options to filter, customize, and extract data based on your preferences:- Filters: Use the Add filters button to segment the displayed information by card brand, currency, date range, and other criteria, including country, issuer country, and network tokens. This allows you to focus on specific data segments for targeted analysis. You can quickly apply or clear large selections using the Select all and inverse selection controls in each filter.
- Personalization: Click Customize to control the reports you see and their arrangement. Drag and drop elements to reorder them according to your priorities, or click the trash bin icon to remove less relevant reports. Remember to click Done to save your personalized layout.
- Set your charts: Use the Add chart button to fine-tune visualizations displayed. After selecting this option, click the icon next to each report to toggle its visibility. Select Apply to confirm your chart selections.
- Export as PDF: The Download button allows you to export the current Insights page as a PDF file. This feature simplifies the process of sharing Yuno’s valuable reports across your organization.
Your custom charts
This section lets you build fully personalized dashboards using natural language prompts. Generate tailored data visualizations that adapt to your analysis needs, all without any manual setup required. You can create as many charts as needed, each born from your written input. Each chart includes an information icon (ⓘ) where you can view the exact prompt used to generate it, providing full transparency and allowing you to easily reuse or refine prompts.Single value
Display a key total or metric at a glance.
Line or bar charts
Visualize trends or compare performance over time.
Multiple line charts
Compare categories such as countries, payment methods, or providers.
Pie charts
Show the proportional distribution of categories within your data.
Best practices for prompting
- Be specific and detailed: Clearly describe what you want to visualize, including relevant details such as transaction type, status, country, provider, or any filters you wish to apply.
- Always include a time range and frequency: When requesting line or bar charts, specify both the period and the aggregation level (e.g., daily, weekly, monthly) for accurate trend analysis.
- Use dynamic time references for reusable charts: Instead of fixed dates, use relative time frames such as “last week” or “previous month” to ensure your charts remain automatically up to date.
Merchant advisory codes (MAC) insights
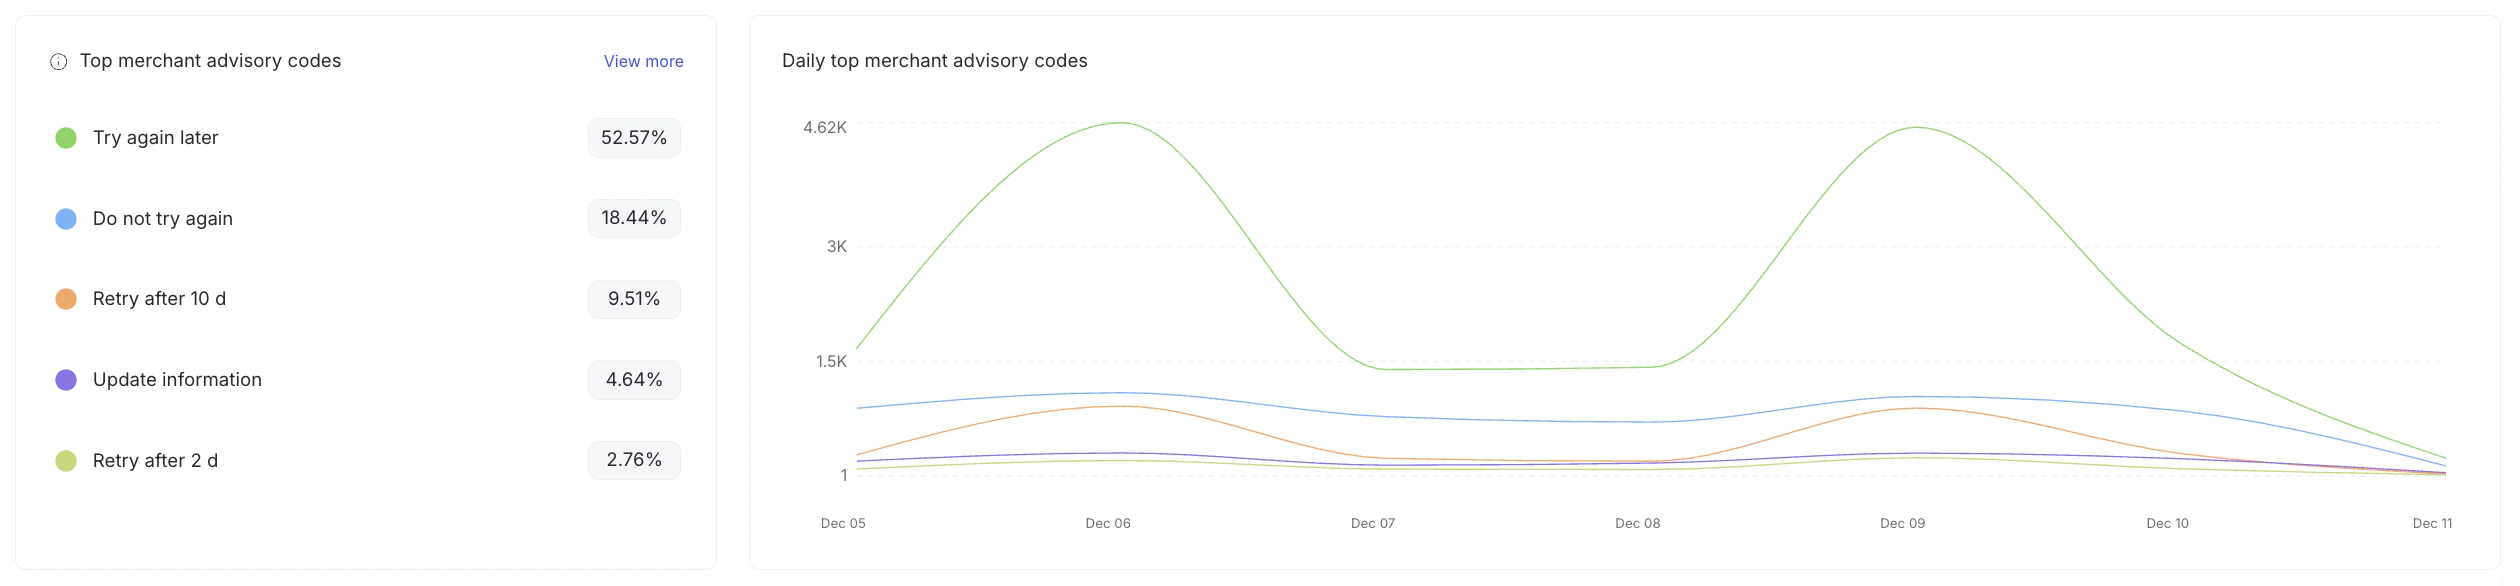
Insights includes charts that highlight merchant advisory codes (MAC), helping you understand why issuers recommend actions such as trying again later or updating information. Key MAC visualisations include:- Top merchant advisory codes: A breakdown of the most frequent MAC codes returned in your transactions, along with their relative share.
- Daily top merchant advisory codes: A time-series chart that shows how the top MAC codes evolve over time, helping you spot trends and changes in issuer behaviour.
Fraud insights
The Fraud tab in Insights provides comprehensive fraud detection and prevention analytics. This section helps you monitor fraud patterns, evaluate the effectiveness of your fraud prevention tools, and make data-driven decisions to protect your business while maintaining a smooth customer experience. The Fraud tab is organized into three main sections:Fraud screening
Monitor fraud screening activities and performance:- Total fraud screening volume: Track the total number of fraud screenings performed
- Successful fraud screening volume: Monitor successful fraud screenings
- Unsuccessful fraud screening volume: Track unsuccessful fraud screenings
- Daily fraud screening conversion rate: View conversion rate trends over time through bar charts
3DS
Analyze 3D Secure authentication performance:- Total 3DS authentication volume: Track total 3DS authentication attempts
- Successful 3DS authentication volume: Monitor successful 3DS authentications
- Unsuccessful 3DS authentication volume: Track unsuccessful 3DS authentications
- Daily 3DS conversion rate: View conversion rate trends over time
- 3DS decline reasons: Analyze reasons for 3DS authentication declines
- Daily fraudiness vs challenge: Compare fraudiness scores against challenge rates
Chargebacks
Monitor chargeback activity and outcomes:- Total chargebacks volume: Track total chargebacks received
- Won chargebacks volume: Monitor chargebacks that were successfully won
- Lost chargebacks volume: Track chargebacks that were lost
- Disputed chargebacks volume: Monitor chargebacks currently in dispute
- Daily chargebacks rate: View chargeback rate trends over time
- Chargebacks rate by provider and card brand: Analyze chargeback rates segmented by provider and card brand
- Chargeback reason distribution: Understand the distribution of chargeback reasons
- Daily chargebacks win rate: Track the rate at which chargebacks are won
- Daily disputed chargebacks: Monitor chargebacks in dispute status
- Chargebacks status distribution: View the distribution of chargeback statuses
- Chargebacks by type: Analyze chargebacks categorized by type